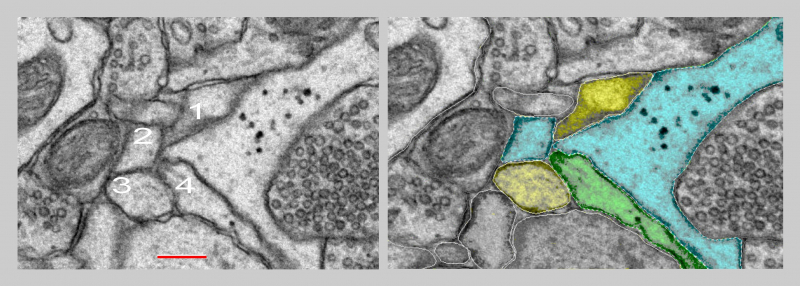
Fig. 1.5.37. Importance of 3D analysis: In the group of processes (1, 2, 3, 4) on the left 2D image, none could be identified with a certainty as astrocytic, axonal, or dendritic (spine). 3D analysis from serial sections (right) safely identificated them as axon (green), astrocyte (blue) and dendritic spines (yellow). Scale = 200 nm. (Hippocampus, rat.)