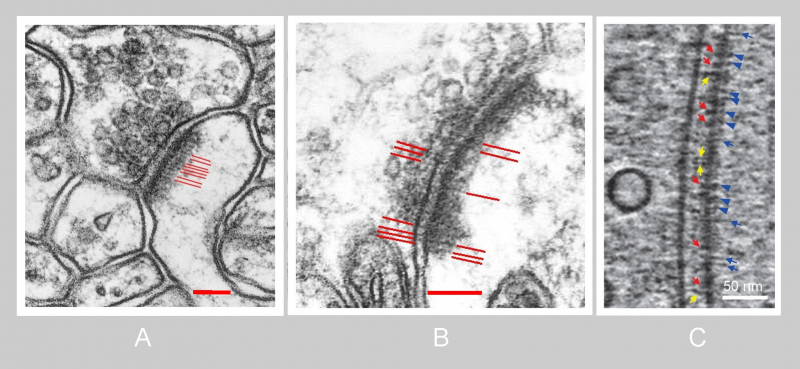
Fig. 1.6.43. Details from Fig. 1.6.06 showing intracellular pre- and postsynaptic filaments associated with receptors and only rarely apparent after a standard chemical fixation (A, B - red lines). Compare to the corresponding structures observed in frozen cultured neurons examined by cryo-electron tomography (C, courtesy of Journal of Neuroscience and Tao et al., 2018; DOI: 10.1523/JNEUROSCI.1548-17.2017). Scales = 100 nm (A, B) and 50 nm (C). Neocortex, mouse (A, B) and a hippocampal neuron, rat (C).)