
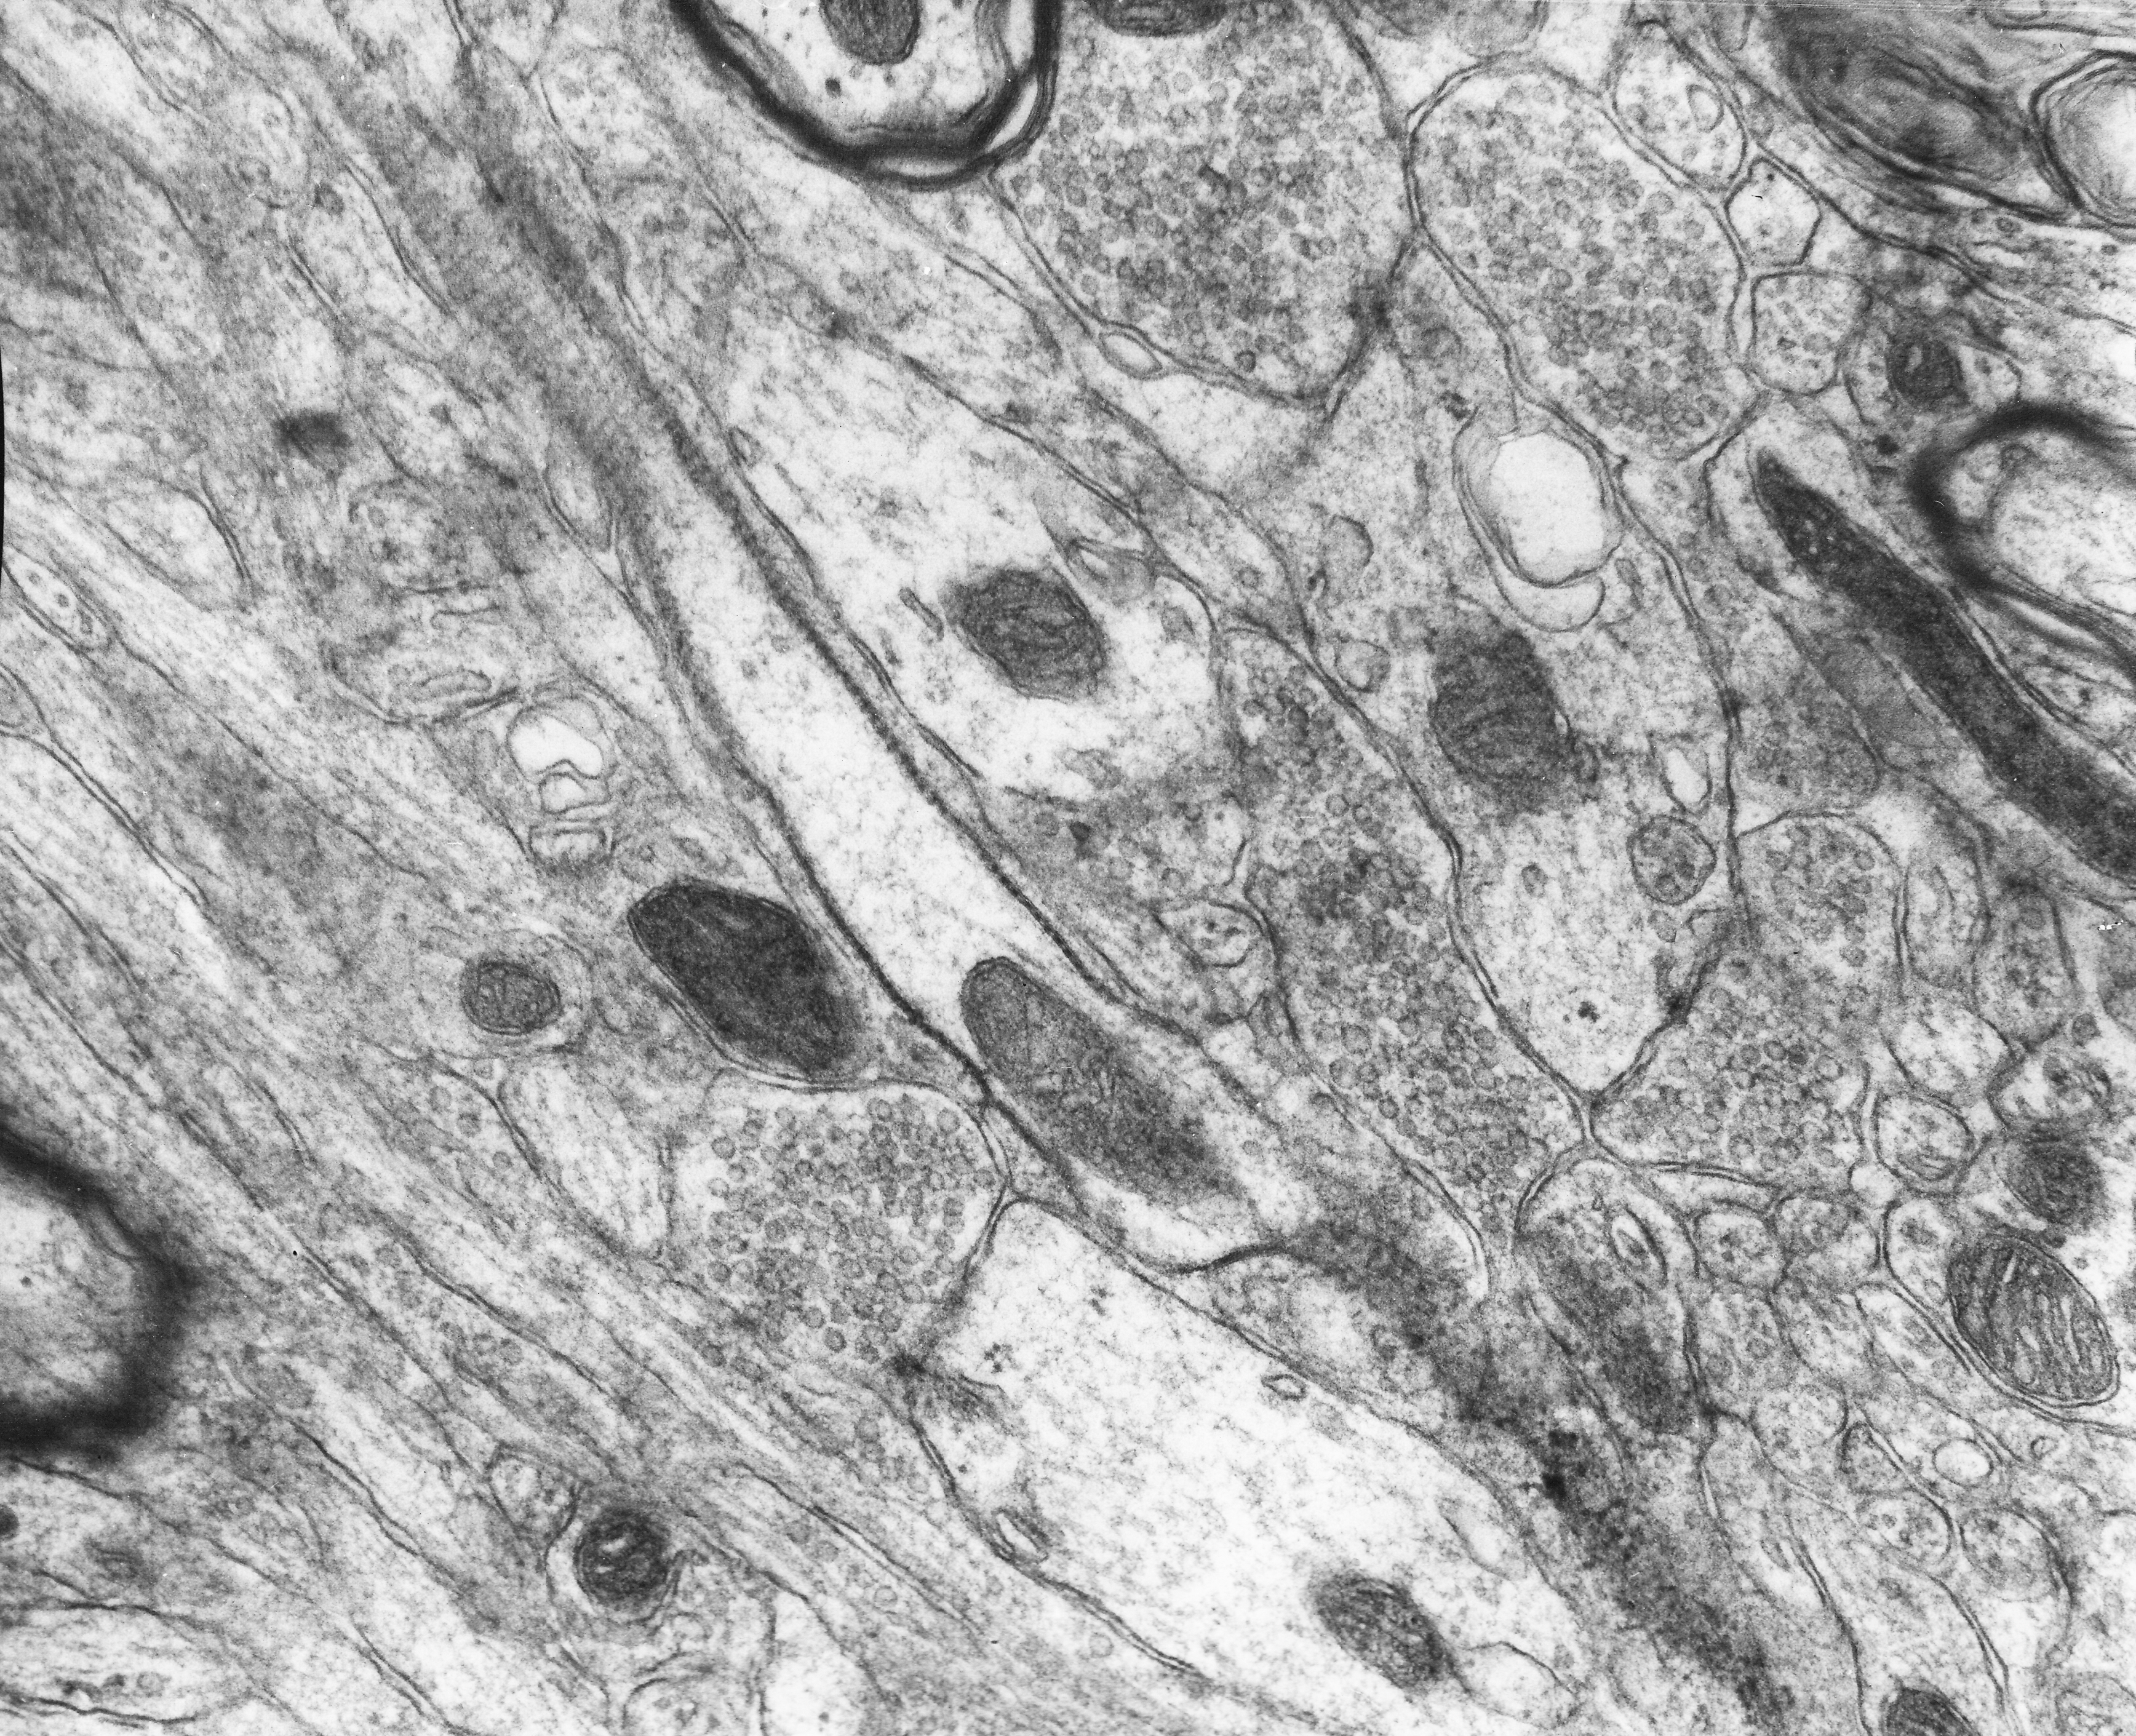
Fig. 2.3.1.07. Paranodal intercellular densities (line arrays) between oligodendroglial loop and axolemma, as they appear in transversal (right) and tangentional (left) section. A - axon close to node of Ranvier. Scale = 0.5 µm. (Rat, thalamus.) Download the high resolution image.