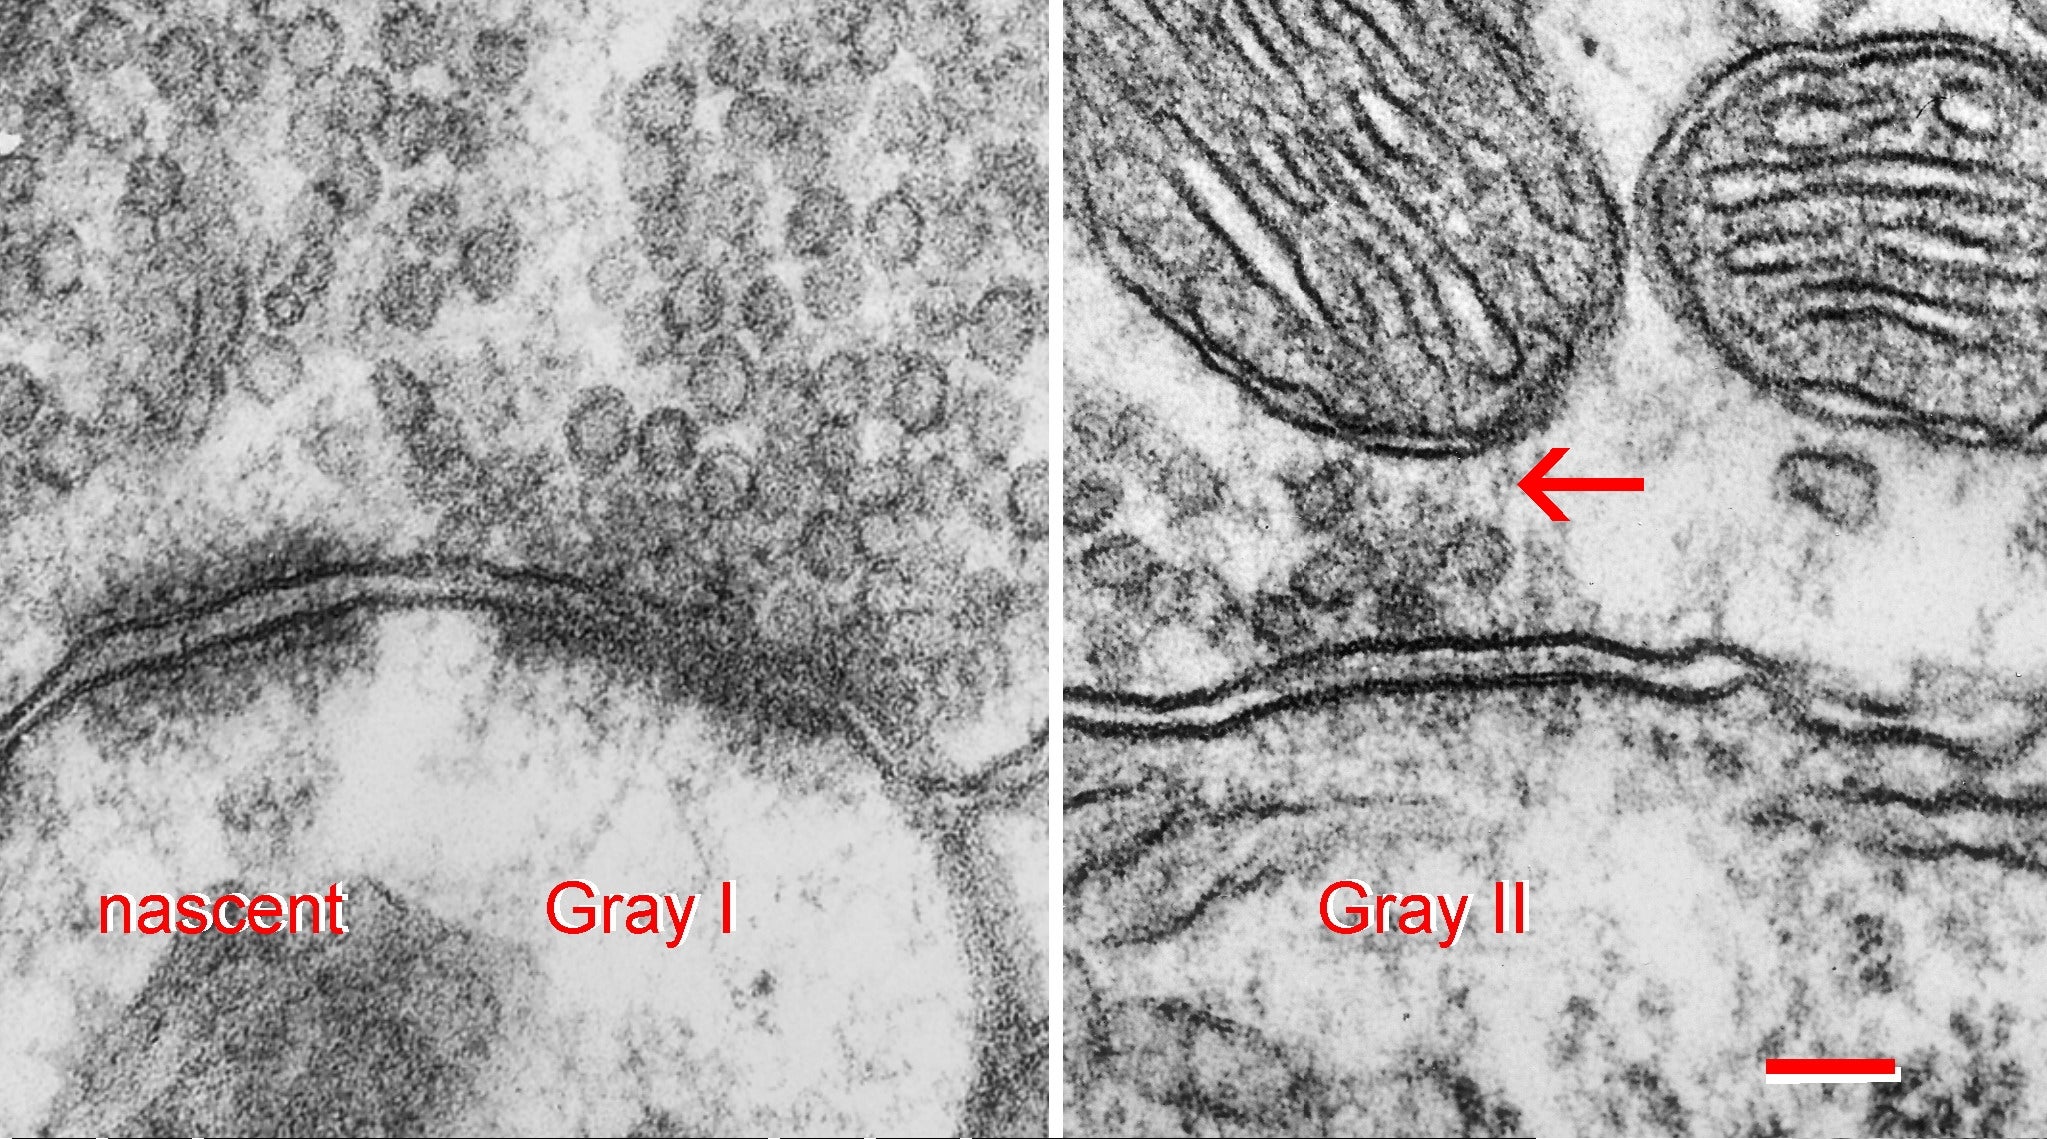
Fig. 1.6.47. Comparison of nascent zone, asymmetric (Gray I), and symmetric (Gray II) synapse. Note fine filaments between mitochondria and synapse (arrow). Download the high resolution image. (Scale = 0.1 µm. Rat, hippocampus.)
Fig. 1.6.47. Comparison of nascent zone, asymmetric (Gray I), and symmetric (Gray II) synapse. Note fine filaments between mitochondria and synapse (arrow). Download the high resolution image. (Scale = 0.1 µm. Rat, hippocampus.)