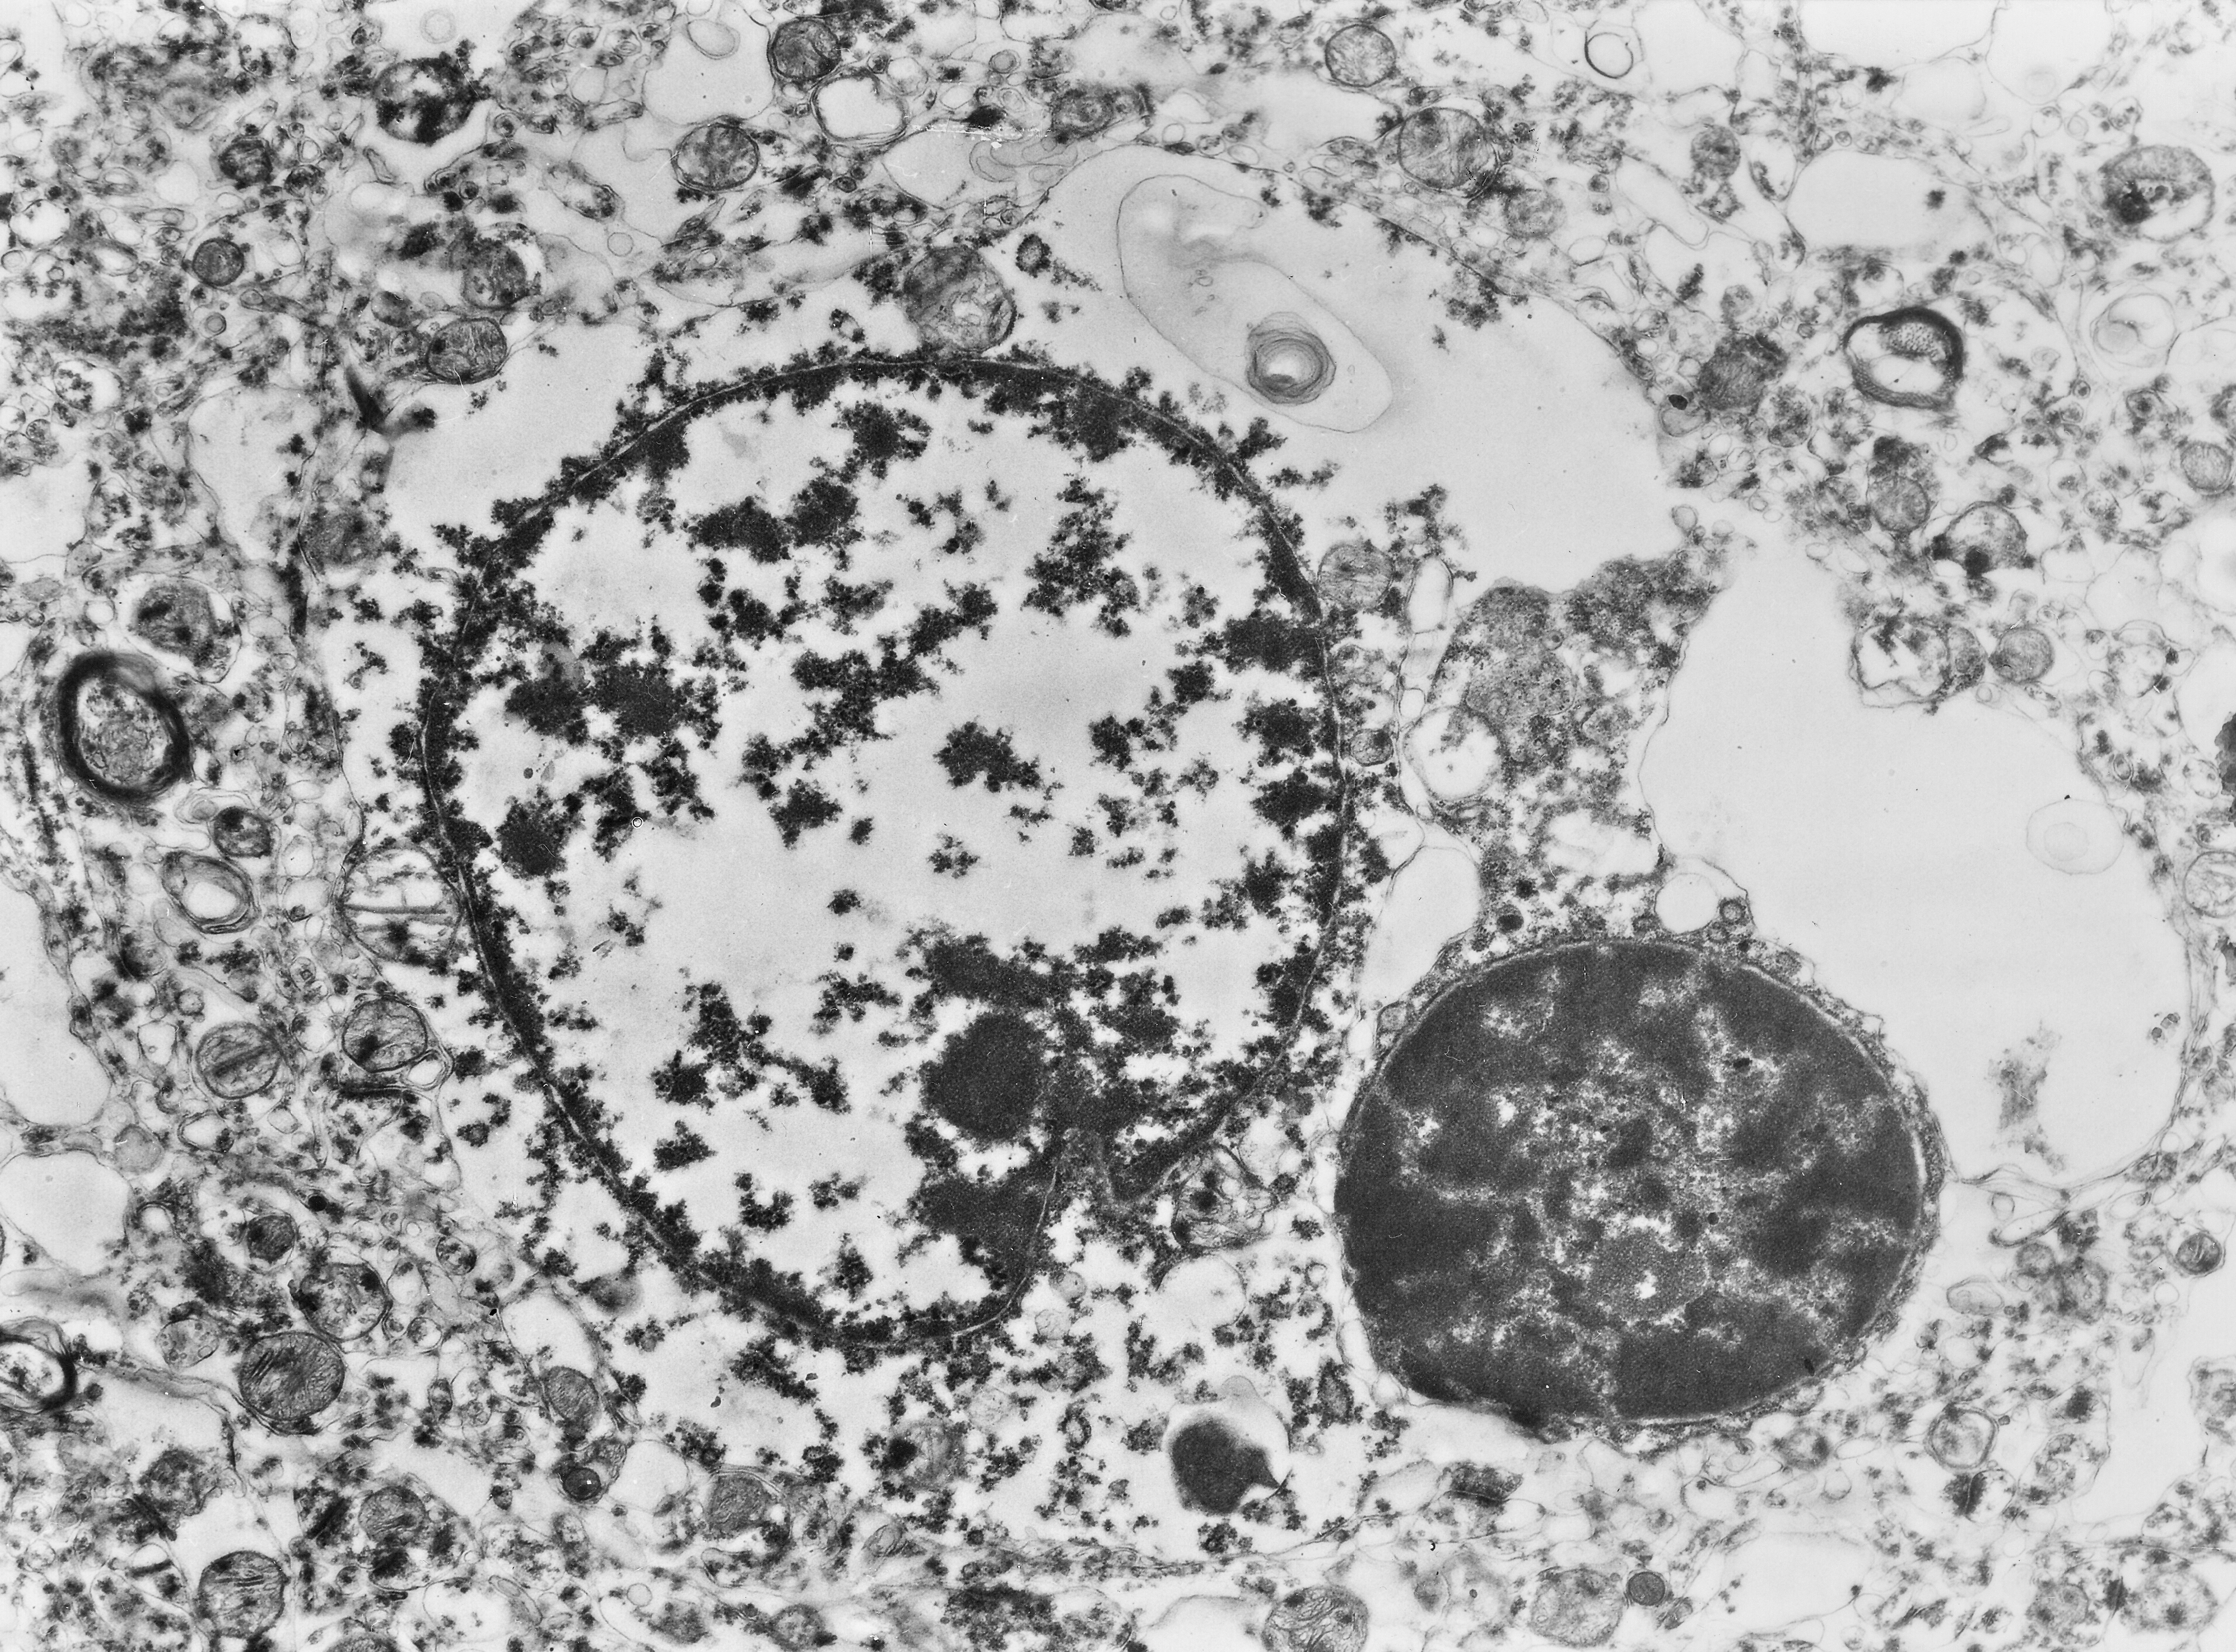
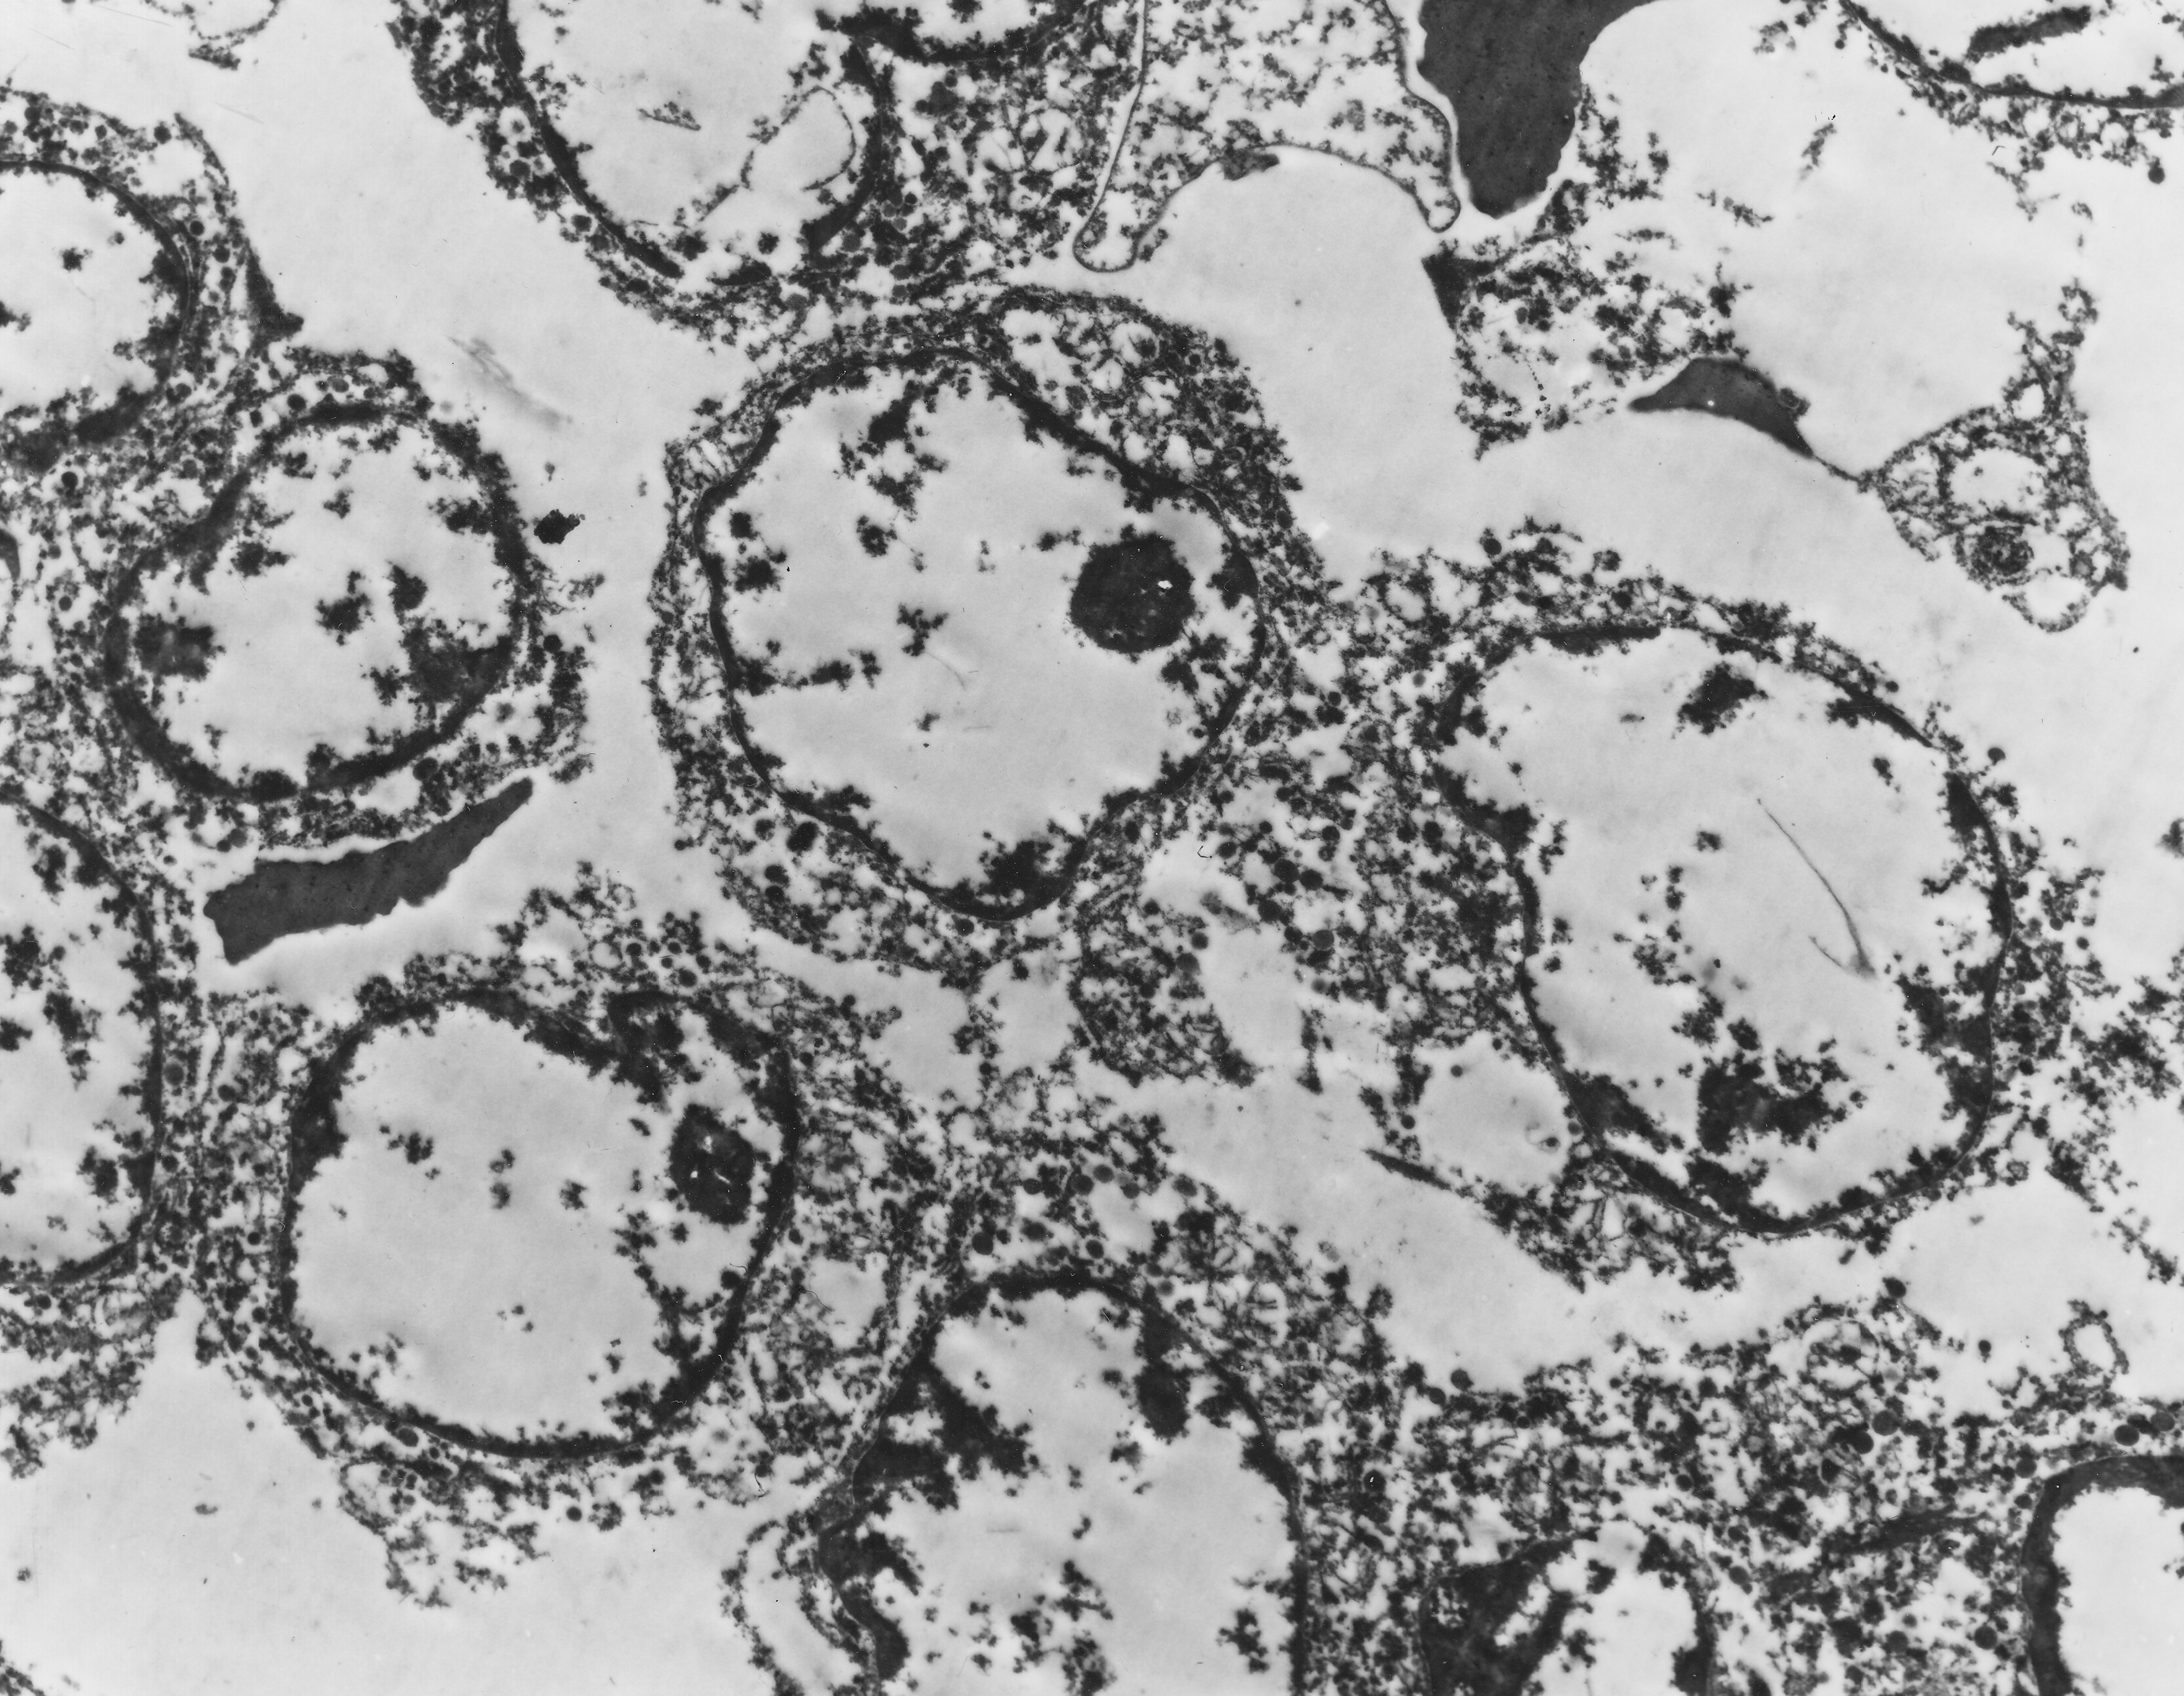
Fig. 7.3.15. Appearances of cells changed by necrosis and autolysis. Autolytic neural perikaryon (N) and oligodendrocyte (O) on left (13 hours post exitum). Necrotic cells from tumor metastasis (M) on right. Scale = 2 µm. (Human, neocortex and brain tumor.) Download the high resolution image (a); Download the high resolution image (b).