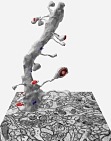

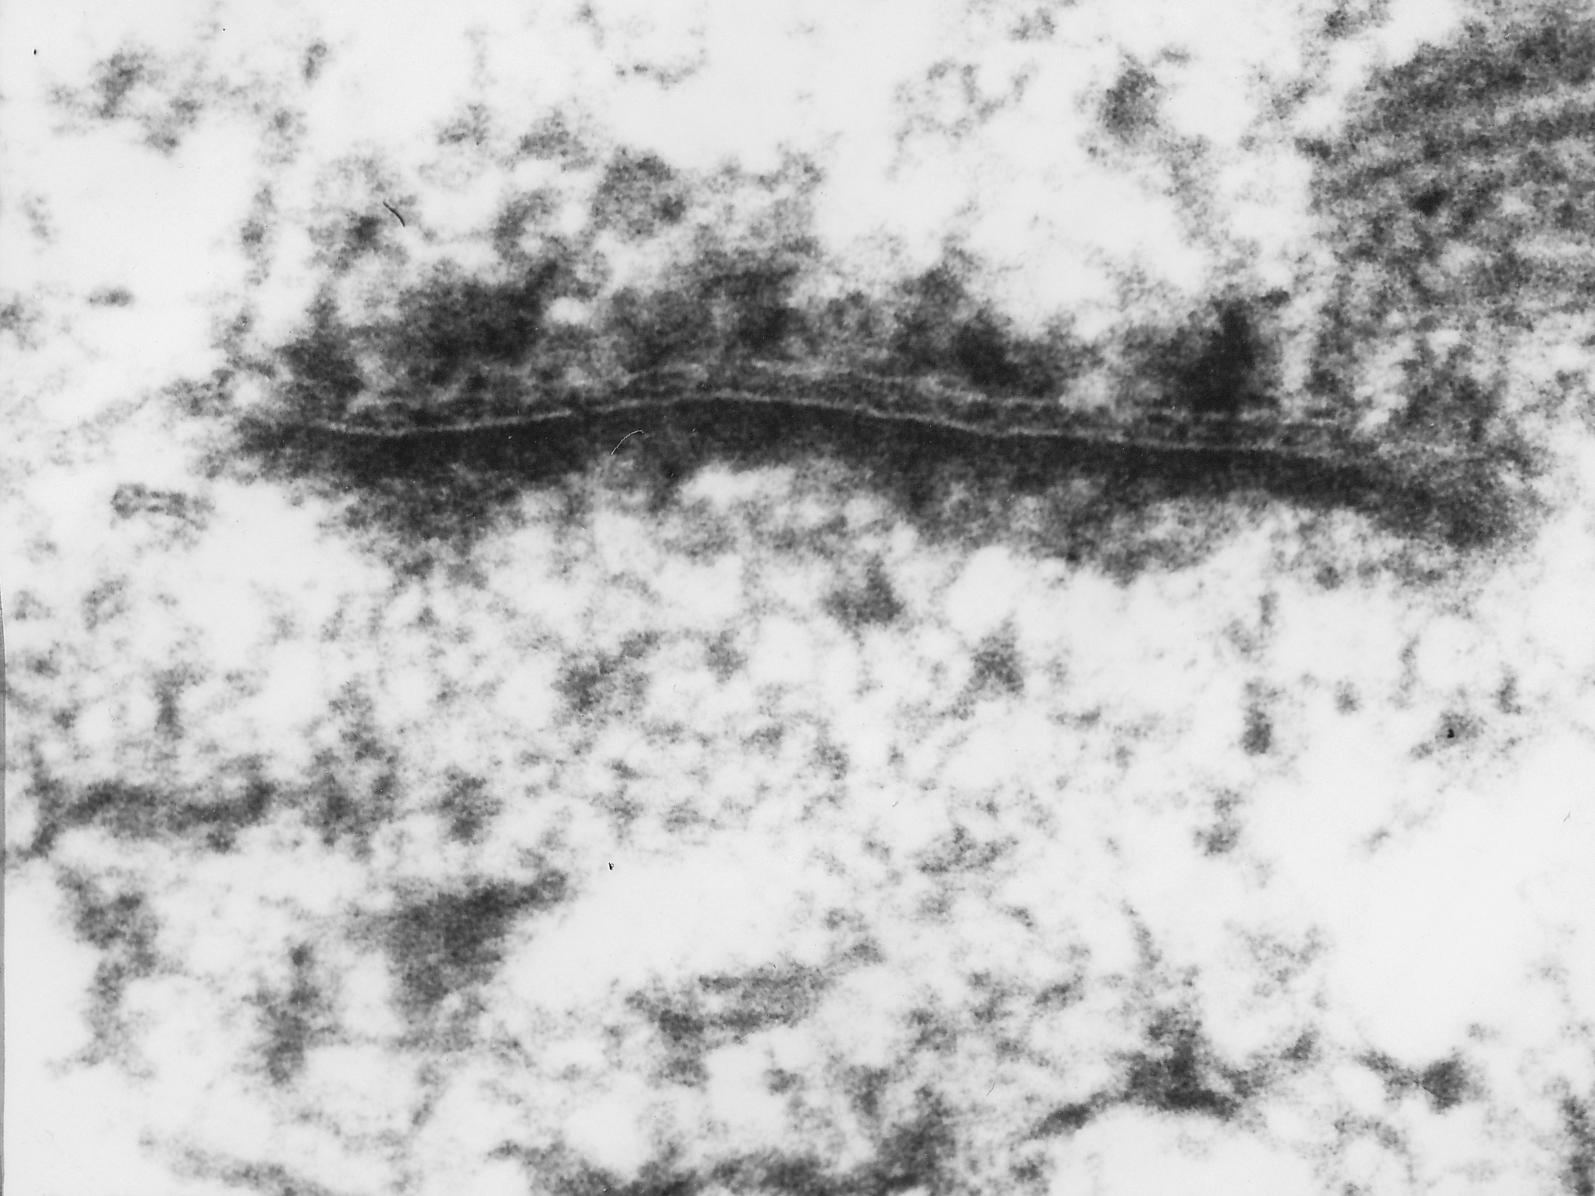
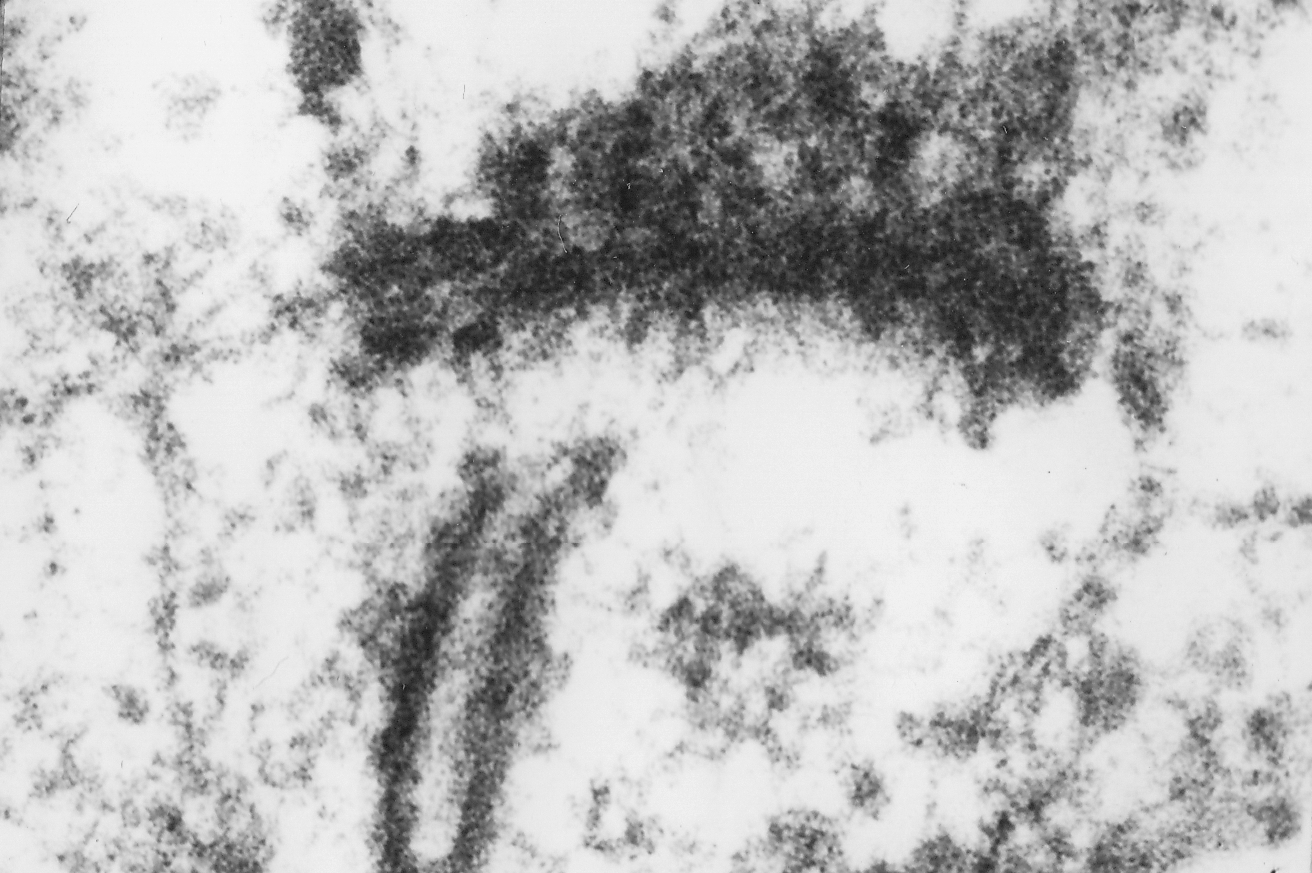
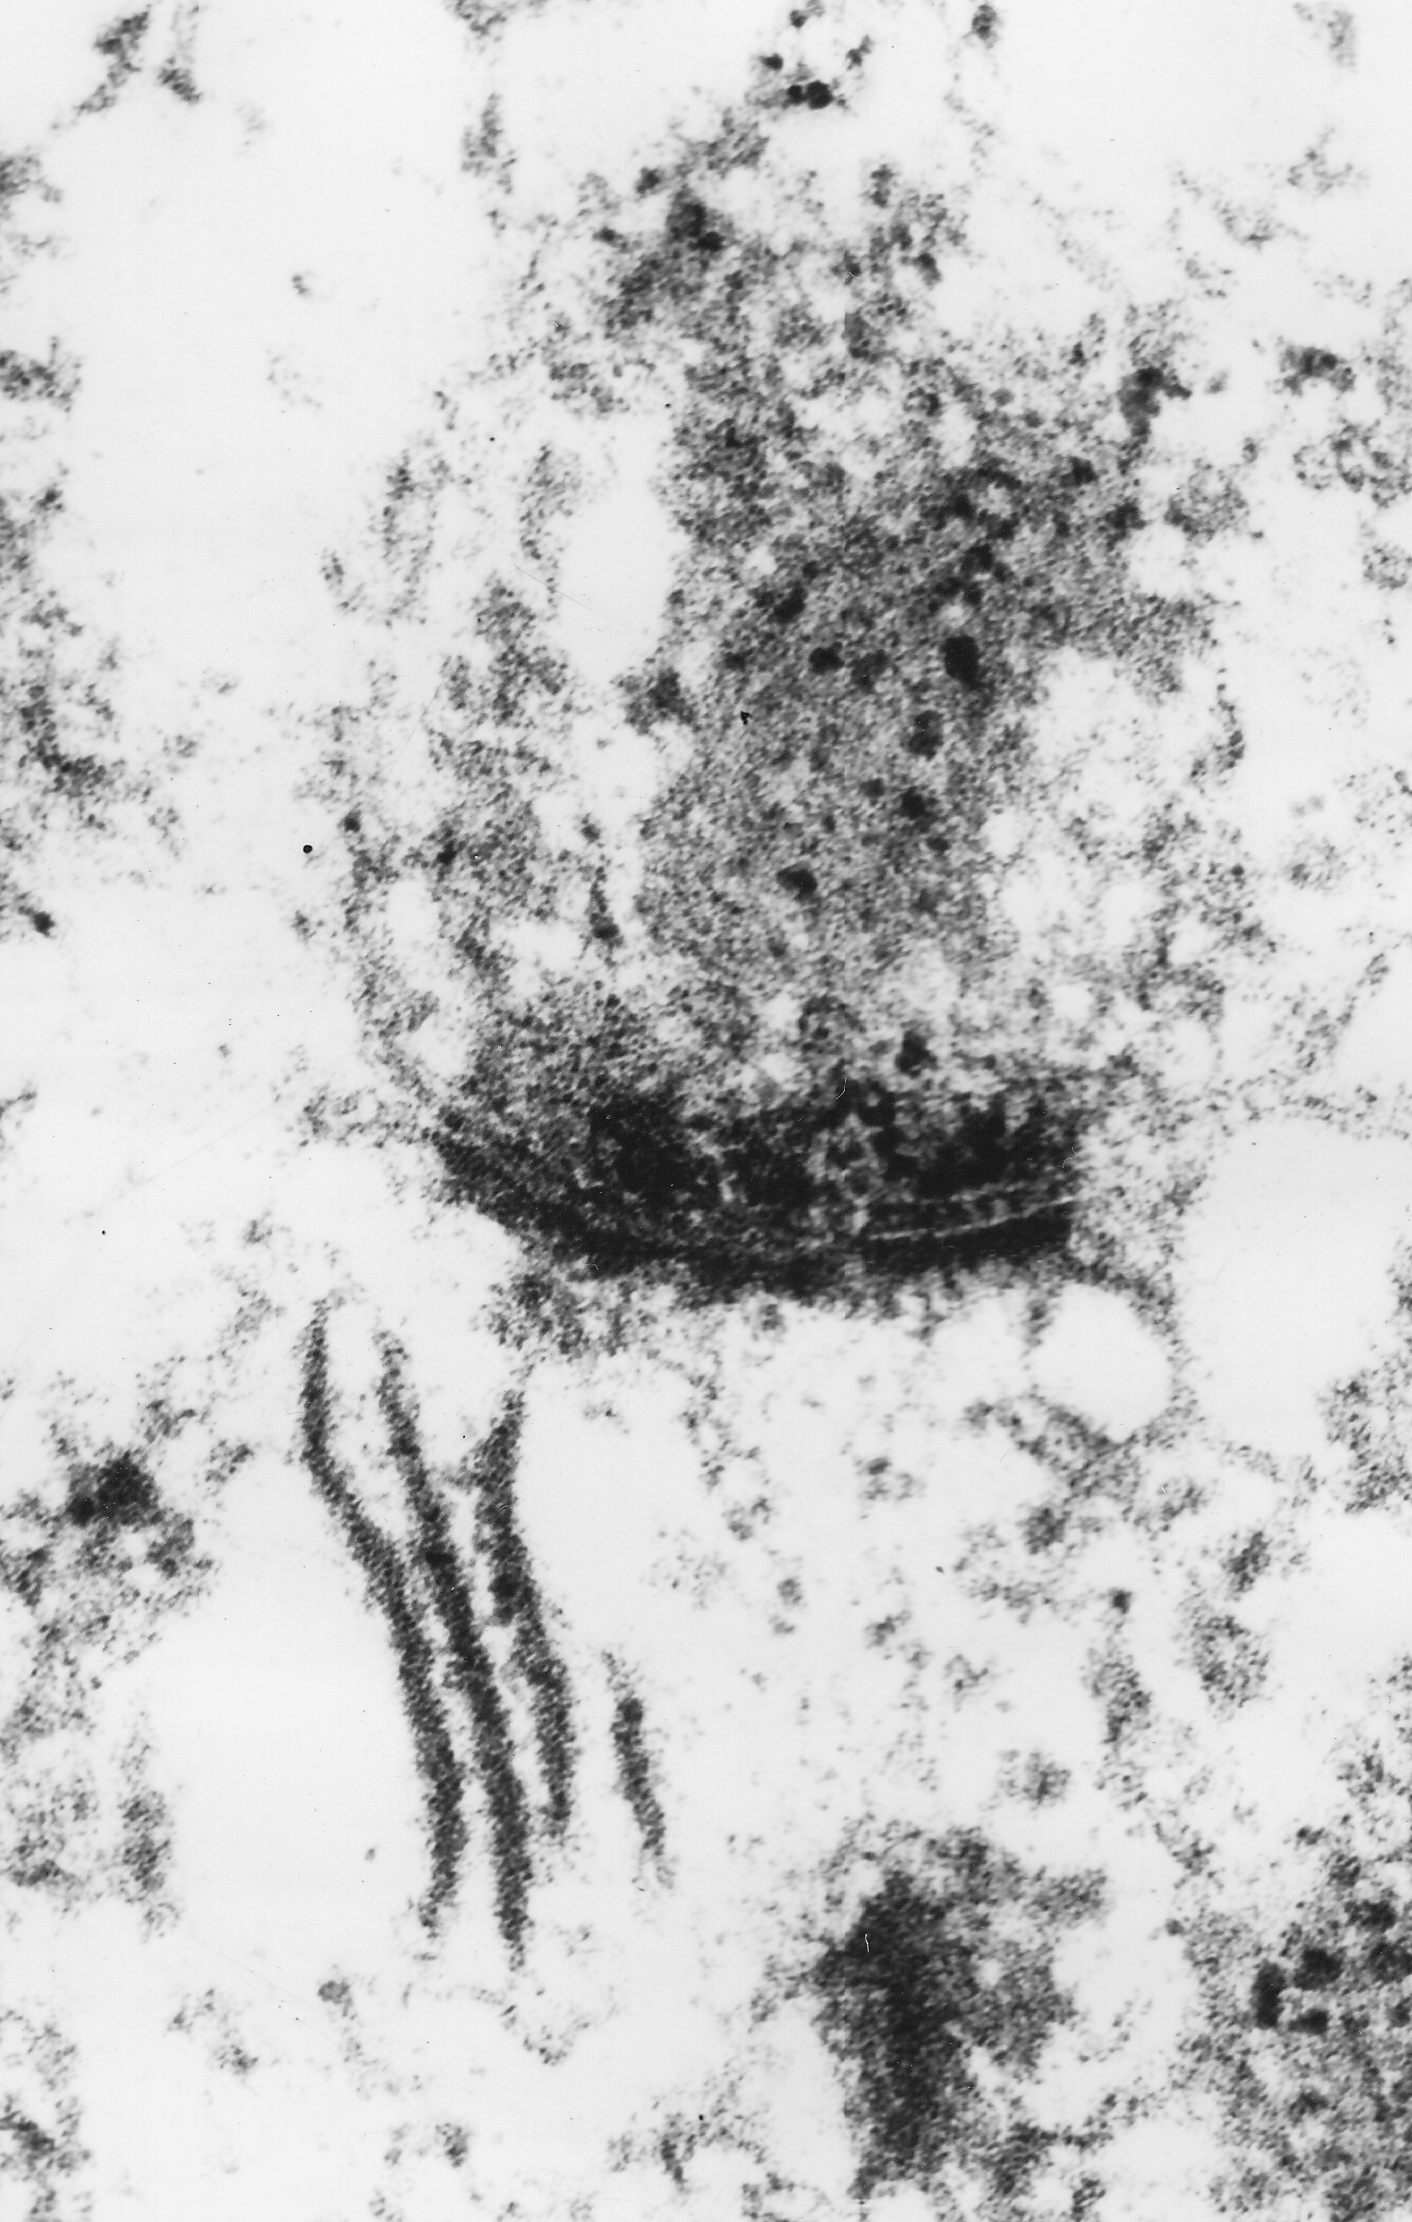
Fig. 1.6.33. Synapses (sy) with presynaptic dense projections (red arrows), postsynaptic densities (blue arrow) and dense plates of the spine apparatus (sa) as they appear after phosphotungstic acid (PTA) treatment. Scale = 100 nm. (Mouse, neocortex.) Download the high resolution image (a); Download the high resolution image (b); Download the high resolution image (c).